
Site monitoring & trending
Metering and daily trending across a national retail distribution footprint, turning interval data into an operational dashboard the facilities team actually uses.
From the site
The work, on the ground.
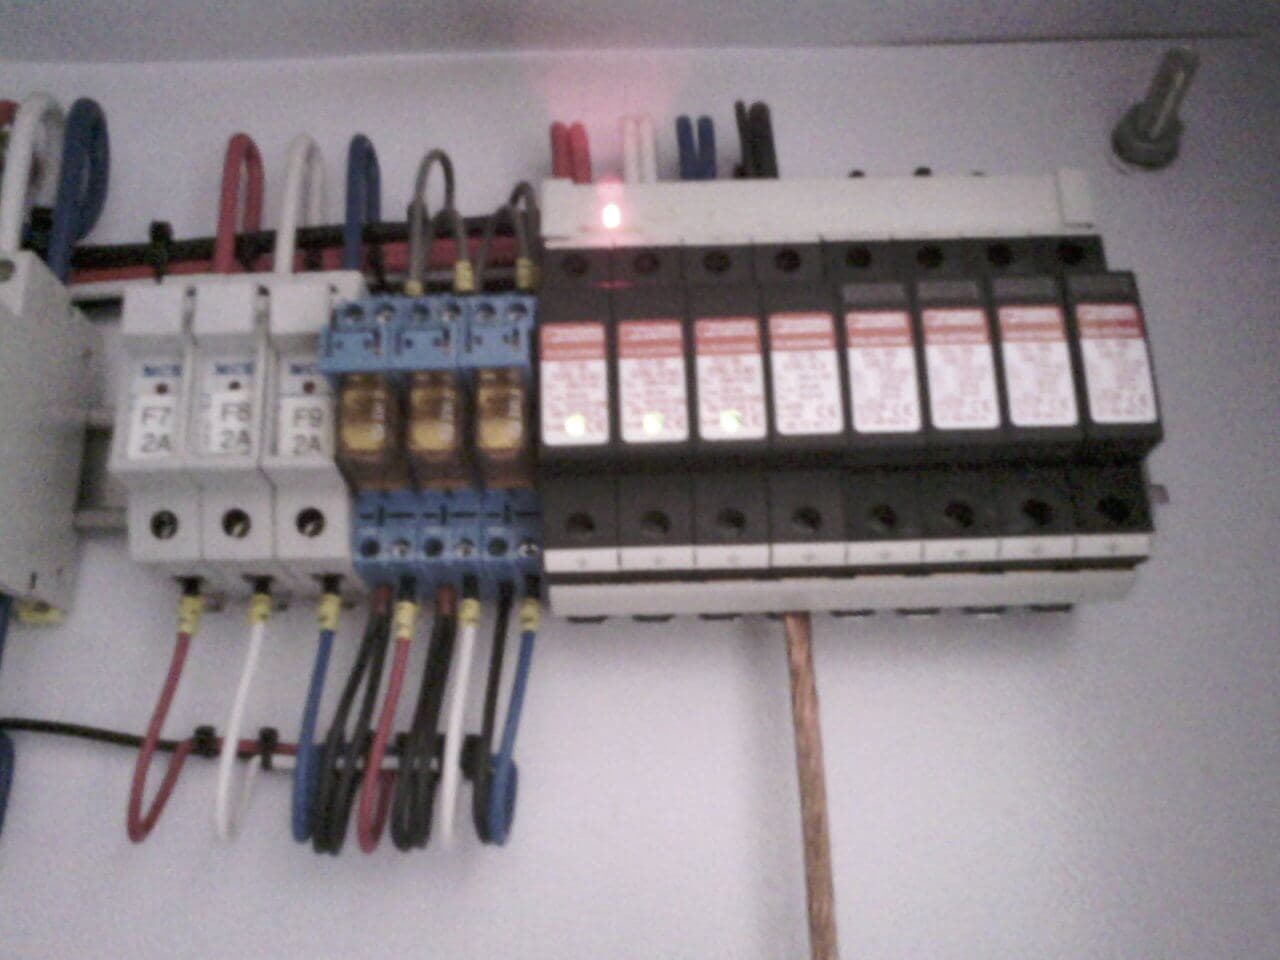
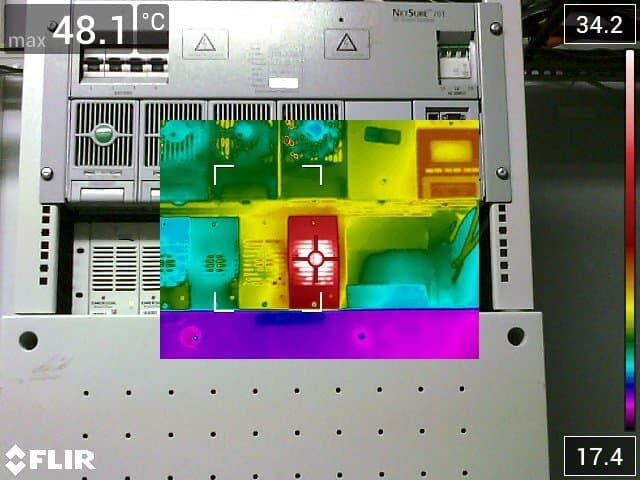
2 site photos — tap a thumbnail to enlarge
Case study
The brief & the work.
The client operates a national group of retail sites with complex energy demand spread across stores, distribution centres and cold chain. Metering existed, but data sat in silos and nothing was reconciled against occupancy, trading hours or weather.
Joule installed the measurement layer, wired interval data into a single dashboard and built daily trending reports with automated alerts. The team now sees load in near-real time, catches anomalies the morning they happen, and works from one trusted view of the site.
What was delivered
- Single consolidated view of all metered sites
- Daily automated trending reports to facilities leadership
- Anomaly alerts for abnormal consumption within 24 hours
Benefits for the customer
- Faster response to unusual consumption
- Less time reconciling spreadsheets
- One trusted source of truth for energy news
Highlights
In their words
“For the first time we have one view of every site. The team reads the daily bulletin and actually acts on it.”
Case study is being finalised by the project team — reach out to discuss this scope directly.
More site work
Continue the portfolio.
Joule Energy — South African delivery
Want this kind of visibility on your sites?
Measurement, monitoring and trending that your facilities team actually uses — designed around how each site operates.